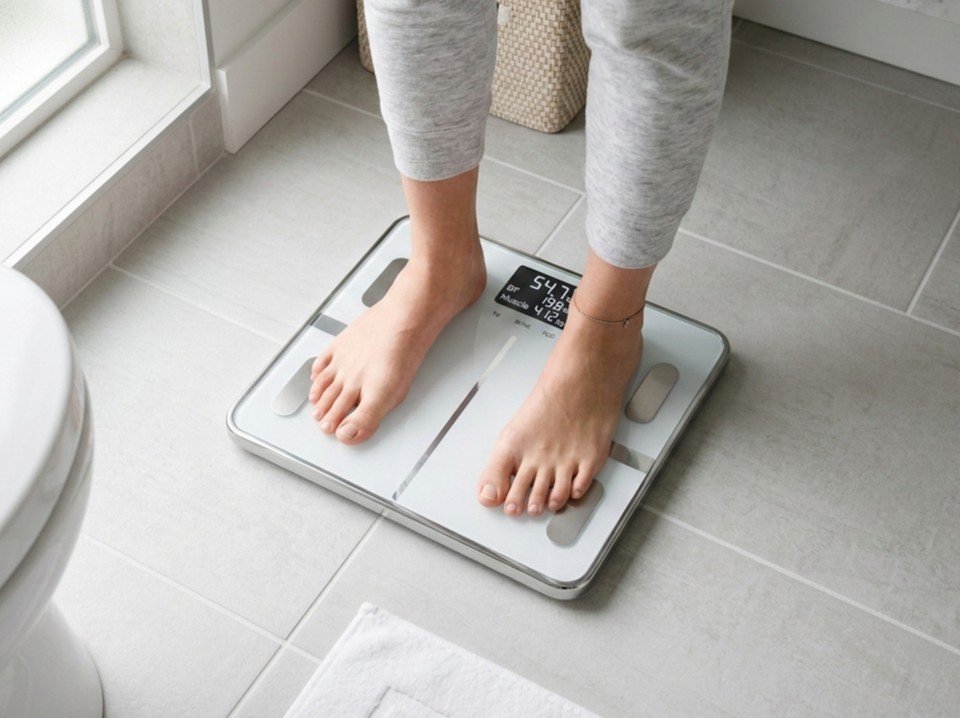
Smart scales display body fat percentage, muscle mass, and visceral fat readings within seconds of stepping on them — yet most users don’t understand what bioelectrical impedance analysis (BIA) actually measures, how it derives body composition from electrical signals, or why the same person can see 5-8% body fat variation between morning and evening measurements.
This guide explains the physics and physiology behind BIA technology, what it measures directly versus what it estimates through mathematical models, the factors that create measurement variation, and realistic accuracy expectations compared to professional body composition methods.
Quick Navigation
- What BIA Actually Measures
- The Physics of Electrical Impedance
- How BIA Scales Calculate Body Fat
- Impedance to Body Composition Formula
- What BIA Measures Directly vs Estimates
- Factors That Affect BIA Accuracy
- BIA vs Other Body Composition Methods
- Why BIA Readings Fluctuate
- How to Get Consistent BIA Measurements
- BIA Limitations and When It Fails
- FAQ
What BIA Actually Measures
Bioelectrical Impedance Analysis measures one thing directly: electrical impedance. Everything else — body fat percentage, muscle mass, bone mass, visceral fat — is calculated through mathematical formulas that estimate body composition based on impedance, height, weight, age, and gender.
Electrical Impedance Defined
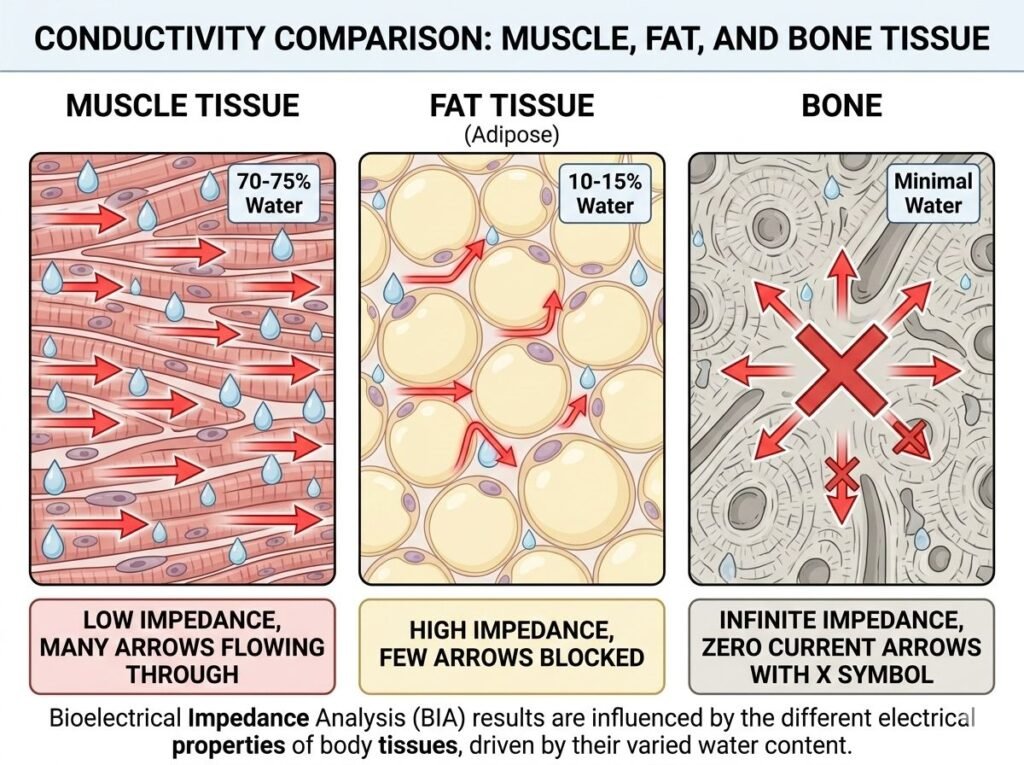
Impedance is resistance to alternating current (AC) electrical flow through a conductor. In the human body, different tissues conduct electricity differently:
High conductivity (low impedance): Water, blood, muscle tissue (70-75% water)
Low conductivity (high impedance): Fat tissue (10-15% water), bone (minimal water)
Air (infinite impedance): Does not conduct electricity at all
BIA devices send a weak electrical current (typically 50 kHz frequency, 500-800 microamps) through your body and measure how much the current is impeded. Higher impedance indicates more fat tissue and less muscle. Lower impedance indicates more muscle and less fat.
What BIA Does NOT Measure Directly
BIA does not directly measure:
- Body fat percentage
- Muscle mass
- Bone density
- Visceral fat volume
- Metabolic rate
- Body water percentage (despite some scales claiming this)
These values are estimated using regression equations based on impedance measurements combined with demographic data (height, weight, age, sex). The accuracy of these estimates depends entirely on how well you match the population used to create the regression equations.
The Physics of Electrical Impedance
Understanding how electricity flows through biological tissue explains both BIA’s capabilities and limitations.
Resistance vs Impedance
Resistance (R): Opposition to direct current (DC) flow. Measured in ohms (Ω).
Impedance (Z): Opposition to alternating current (AC) flow. Also measured in ohms but includes both resistance and reactance (phase shift). Formula: Z = √(R² + X²) where X is reactance.
BIA uses AC current because it can penetrate cell membranes, allowing measurement of both extracellular water (outside cells) and intracellular water (inside cells). DC current cannot penetrate cell membranes and would only measure extracellular water.
Tissue Conductivity Differences
Lean tissue (muscle): 70-75% water with dissolved electrolytes (sodium, potassium, chloride). High water content and electrolyte concentration create low electrical resistance — electricity flows easily.
Fat tissue: 10-15% water with minimal electrolytes. Low water content creates high electrical resistance — electricity barely flows through fat.
Bone: Minimal water content, extremely high resistance. BIA essentially treats bone as non-conductive.
Key insight: BIA doesn’t detect fat directly. It detects water and electrolytes. Fat is calculated by subtracting estimated lean mass (high water) from total body mass. If BIA estimates you have 60 kg of lean mass and you weigh 80 kg, it calculates 20 kg (25%) body fat.
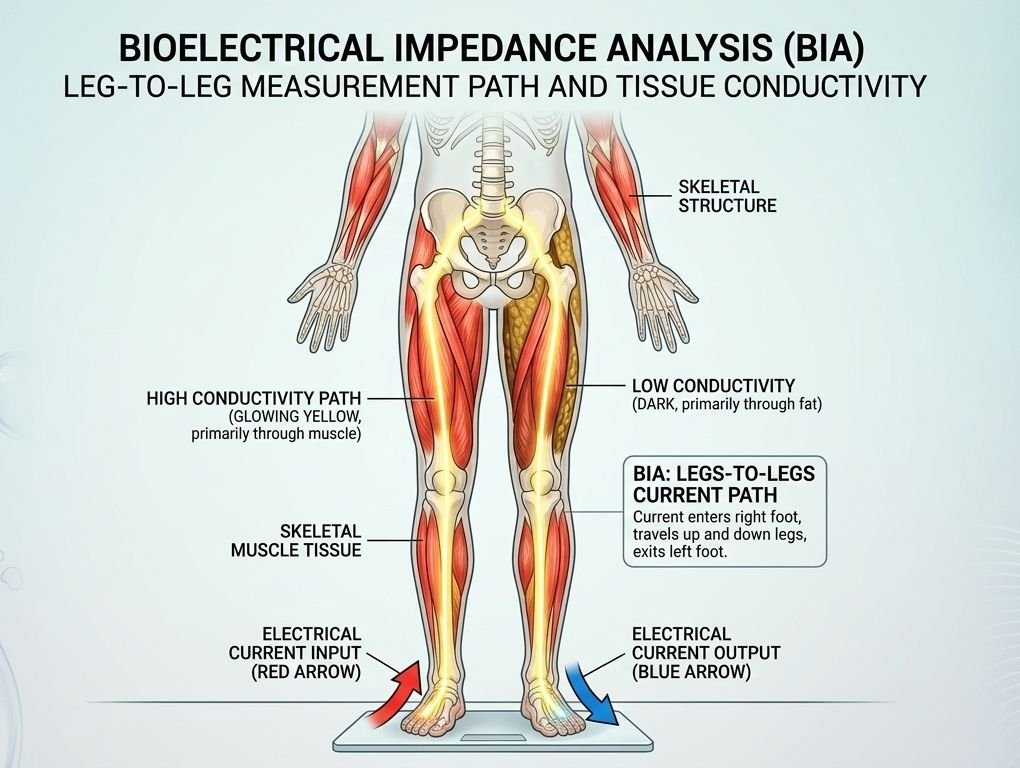
Current Path Through Body
Foot-to-foot BIA scales (most consumer scales) send current up one leg, through the pelvis, down the other leg. The current takes the path of least resistance — primarily through muscle and blood in the legs and lower torso.
What this means:
- Lower body composition heavily weighted in measurement
- Upper body composition estimated from correlations
- Fat distribution affects accuracy — someone with fat concentrated in legs gets different reading than someone with fat concentrated in abdomen
Hand-to-hand and hand-to-foot (8-electrode) devices provide more complete body measurements by sending current through arms and legs separately, but consumer models are mostly foot-to-foot due to cost.
How BIA Scales Calculate Body Fat Percentage
The process from stepping on a scale to seeing body fat percentage involves multiple calculation steps using impedance measurements and demographic data.
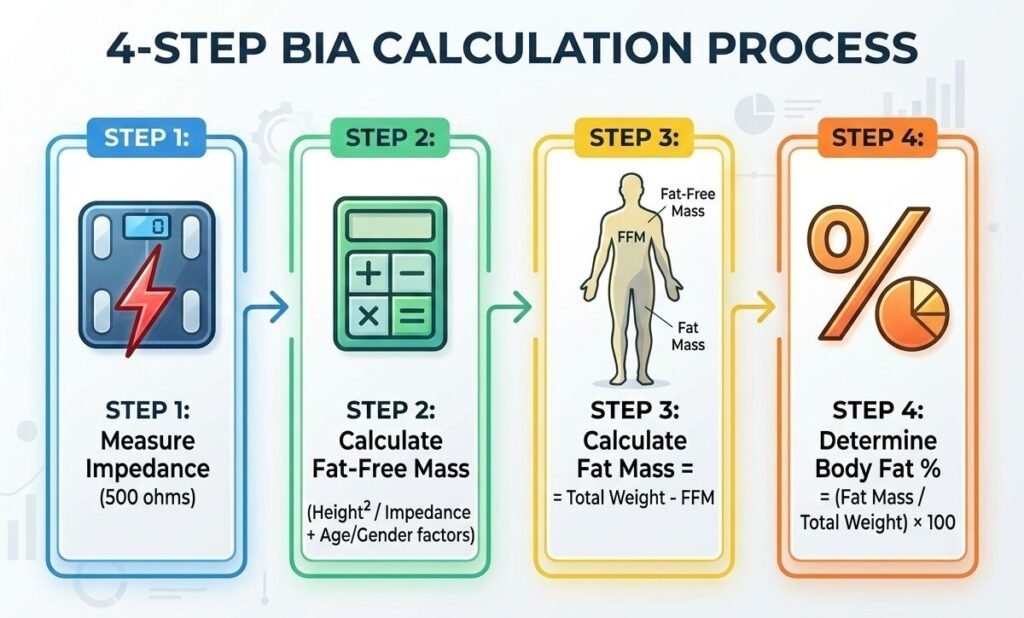
Step 1: Measure Impedance
Scale sends 50 kHz AC current through your body (typically 500-800 microamps — below sensation threshold). Electrodes measure voltage drop across the body. Impedance calculated using Ohm’s law: Z = V / I (impedance = voltage / current).
Typical impedance values:
- Athletic lean male: 400-500 ohms
- Average male: 500-600 ohms
- Higher body fat male: 600-700+ ohms
- Values are roughly 50-100 ohms higher for females due to typically higher body fat
Step 2: Calculate Fat-Free Mass (FFM)
BIA scales use regression equations developed from studies comparing impedance to reference body composition methods (DEXA, hydrostatic weighing). A simplified version:
FFM (kg) = (Height² / Impedance) × Gender Factor + Age Factor + Constant
The actual equations are proprietary and more complex, but the principle is: taller people have longer current paths (more impedance), males have more muscle than females at same impedance, older people have less muscle than younger at same impedance.
Step 3: Calculate Body Fat
Body Fat Mass = Total Weight – Fat-Free Mass
Body Fat Percentage = (Body Fat Mass / Total Weight) × 100
If scale calculates 65 kg fat-free mass and you weigh 80 kg:
- Body fat mass = 80 – 65 = 15 kg
- Body fat percentage = (15 / 80) × 100 = 18.75%
Step 4: Estimate Additional Metrics
From impedance and fat-free mass, scales estimate:
Muscle mass: FFM minus bone mass estimate (bone estimated from height, weight, age, sex)
Bone mass: Typically estimated as 15-20% of FFM based on demographic data
Visceral fat: Estimated from impedance, total body fat, age, and waist circumference (if manually entered)
Body water: Estimated as percentage of FFM (lean tissue is ~73% water)
Each additional metric adds another layer of estimation and potential error.
The Impedance to Body Composition Formula
The regression equations BIA uses are developed by measuring thousands of people with both BIA and reference methods (DEXA), then creating statistical models that predict body composition from impedance + demographics.
Population-Specific Equations
Different equations exist for:
- General adult population
- Athletes (higher muscle mass than average)
- Elderly (lower muscle mass, different hydration)
- Children and adolescents
- Obese individuals (different fat distribution)
Critical limitation: Consumer BIA scales typically use general population equations. If you don’t match the general population (athlete, very lean, very obese, elderly), the equation produces inaccurate results.
The “Black Box” Problem
Scale manufacturers don’t publish their proprietary equations. You can’t know:
- Which population data was used to create equations
- How recent the validation studies are
- What accuracy standards were met
- Whether equations are updated with new research
This makes it impossible to assess accuracy for your specific body type without comparing to a reference method.
What BIA Measures Directly vs Estimates
Understanding this distinction sets realistic expectations for BIA accuracy.
Directly Measured
Impedance: The only truly measured value. Modern BIA scales measure impedance to within 1-2 ohms accuracy.
Weight: Measured directly via load cells. Typically accurate to ±0.1-0.2 kg.
First-Level Estimates (Moderate Accuracy)
Fat-free mass: Estimated from impedance using validated regression equations. Error typically ±3-5% compared to DEXA in general population.
Total body water: Estimated from impedance. Error ±2-4% compared to isotope dilution methods.
Second-Level Estimates (Lower Accuracy)
Body fat percentage: Calculated from fat-free mass estimate. Error compounds from FFM estimation. Typical error ±3-5% compared to DEXA.
Muscle mass: Estimated by subtracting bone mass from FFM. Error ±4-6%.
Third-Level Estimates (Lowest Accuracy)
Visceral fat: Estimated from total fat distribution models. No direct measurement. Error significant — primarily useful for tracking trends, not absolute values.
Bone mass: Estimated from demographic data with minimal individual measurement. Error ±15-25%.
Metabolic rate: Calculated from estimated muscle mass using standard equations. Error compounds through multiple estimation steps.
For comprehensive fitness tracking that goes beyond BIA, see our guide to smart health gadgets for tracking sleep and heart rate.
Factors That Affect BIA Accuracy
BIA measurements vary based on hydration, food intake, exercise, time of day, and measurement conditions. Understanding these factors explains why body fat percentage can fluctuate 5-8% within 24 hours.
Hydration Status
Primary accuracy factor: Hydration changes impedance dramatically. More water = lower impedance = higher estimated muscle, lower estimated fat. Less water = higher impedance = lower estimated muscle, higher estimated fat.
Impact magnitude: Drinking 1 liter of water can reduce body fat percentage reading by 1-2% within 30 minutes as water distributes through the body and lowers impedance.
Why it matters: Someone measuring dehydrated in the morning then hydrated in the evening can see 3-5% body fat variation with no actual fat change.
Food and Drink Intake
Recent meals: Food in digestive system adds weight but doesn’t conduct electricity well, affecting weight-to-impedance ratio and increasing estimated fat percentage.
Alcohol: Dehydrating effect increases impedance, increasing estimated body fat.
Caffeine: Mild diuretic effect can increase impedance slightly.
Sodium: High sodium intake causes water retention (lowers impedance), decreasing estimated body fat temporarily.
Recommendation: Measure at least 2-3 hours after eating, 8-12 hours after alcohol consumption.
Exercise Timing
During/immediately after exercise: Blood flow redirected to working muscles changes impedance distribution. Sweat loss (dehydration) increases impedance. Measurements unreliable.
4-6 hours after intense exercise: Muscle inflammation and glycogen/water depletion affect impedance. BIA overestimates muscle mass and underestimates fat.
Recommendation: Measure at least 12 hours after intense exercise for consistency.
Time of Day
Morning (upon waking): Most consistent measurement time. Overnight lying position redistributes body water evenly. Dehydration from overnight fluid loss is consistent day-to-day.
Evening: Water accumulates in lower extremities throughout the day (standing, sitting). Leg impedance decreases (more water), affecting foot-to-foot BIA readings.
Variation: Same person can measure 2-3% lower body fat in evening vs morning due to fluid redistribution, with no actual body composition change.
Environmental Factors
Skin temperature: Cold skin increases impedance. Warm skin decreases impedance. Temperature variation can create 1-2% body fat reading variation.
Contact quality: Dry, callused feet increase contact impedance. Wet feet decrease impedance. Inconsistent contact creates measurement noise.
Recommendation: Measure at consistent room temperature, ensure clean dry feet with consistent contact pressure.
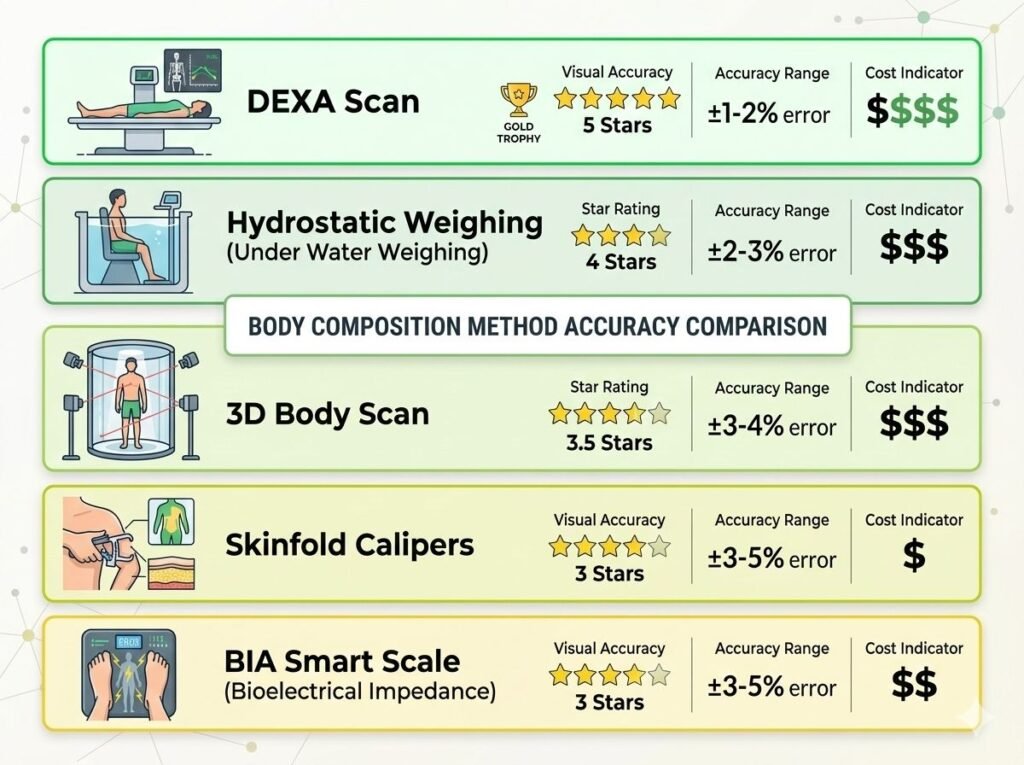
BIA vs Other Body Composition Methods
Comparing BIA to gold-standard methods reveals its accuracy limitations and appropriate uses.
DEXA Scan (Dual-Energy X-ray Absorptiometry)
Method: X-rays at two energy levels differentiate bone, lean tissue, and fat tissue.
Accuracy: ±1-2% body fat error — considered gold standard for research and clinical use.
Cost: $50-150 per scan
Accessibility: Requires medical facility with DEXA machine
Comparison to BIA: DEXA is 2-3× more accurate than BIA. BIA error is ±3-5%, DEXA is ±1-2%.
Hydrostatic (Underwater) Weighing
Method: Body density measured by weighing in water. Fat floats, muscle sinks — density indicates composition.
Accuracy: ±2-3% body fat error when performed correctly
Cost: $30-75 per test
Accessibility: Requires specialized facility with submersion tank
Comparison to BIA: Similar accuracy to BIA but measures different property (density vs impedance). Less convenient than home BIA.
Bod Pod (Air Displacement Plethysmography)
Method: Air displacement in sealed chamber measures body volume, calculates density and composition.
Accuracy: ±2-3% body fat error
Cost: $40-75 per test
Accessibility: Requires specialized facility
Comparison to BIA: Similar accuracy to BIA, more consistent day-to-day because not affected by hydration like BIA.
Skinfold Calipers
Method: Pinch skin and fat at specific body sites, measure thickness with calipers, calculate body fat from sum of measurements.
Accuracy: ±3-5% error with experienced tester, ±5-10% with inexperienced user
Cost: $5-30 for calipers
Accessibility: Can be done at home but requires training and consistent technique
Comparison to BIA: Similar accuracy to BIA when performed by experienced tester. More technique-dependent than BIA.
3D Body Scanning
Method: Infrared cameras create 3D body model, estimate composition from body shape and circumferences.
Accuracy: ±3-4% body fat error
Cost: $30-50 per scan (commercial), $500+ for home device
Accessibility: Growing — found in some gyms, supplement stores
Comparison to BIA: Similar accuracy, not affected by hydration. Limited availability currently.
For tracking body composition trends alongside other health metrics, modern smart scales combine BIA with weight tracking and app integration.
Why BIA Readings Fluctuate Daily
Understanding normal variation prevents over-interpreting daily changes and helps identify actual trends.
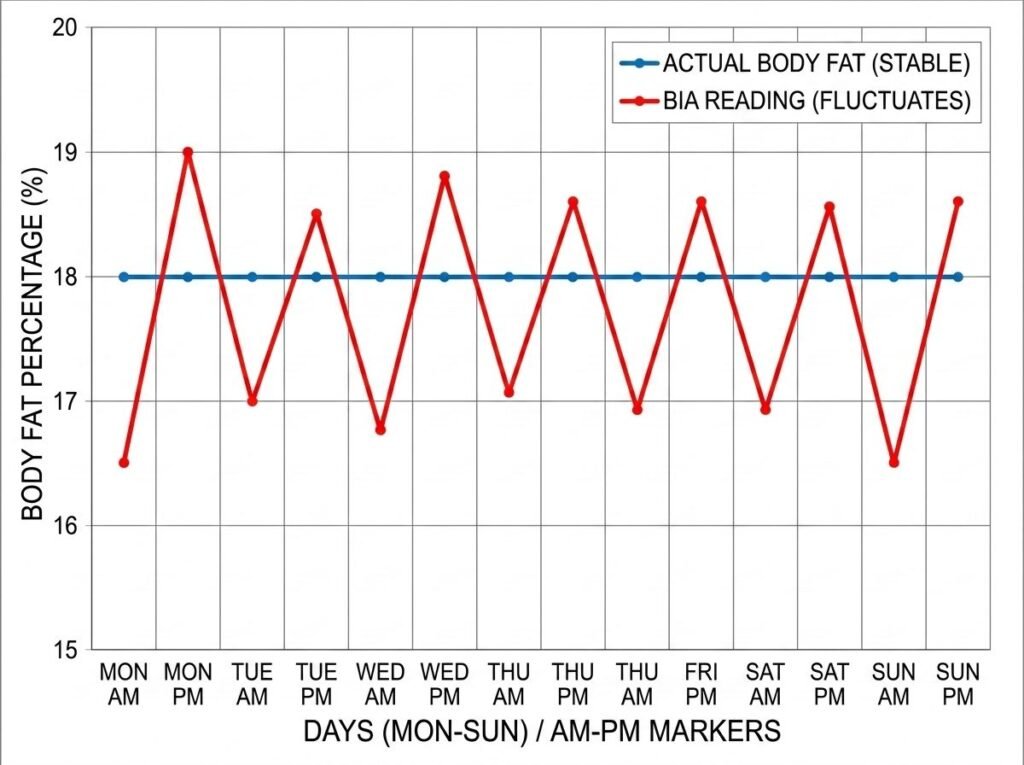
Normal Daily Fluctuation
Body fat percentage: ±1-3% variation from morning to evening is normal
Weight: ±0.5-2 kg variation throughout day is normal (food, water, waste)
Muscle mass: ±0.5-1.5 kg variation is normal (water distribution)
What Causes Variation
Morning dehydration: Overnight fluid loss (breathing, sweating) increases impedance consistently
Daytime rehydration: Drinking water decreases impedance progressively through the day
Food weight: Adds 0.5-1.5 kg weight but minimal impedance change, skewing body fat calculation
Leg fluid accumulation: Gravity pulls fluid to legs during upright activity, changing leg impedance (affects foot-to-foot scales most)
Glycogen fluctuation: Muscles store 300-500g glycogen + 900-1500g water. Exercise depletes glycogen (less water = higher impedance), eating replenishes it (more water = lower impedance)
Actual Body Composition Change Timeline
Fat loss/gain: Requires calorie deficit/surplus over days to weeks. Real fat change is 0.5-1 kg per week maximum (with aggressive diet). Daily fat change of 0.5+ kg is impossible — it’s water/food weight.
Muscle gain: Requires resistance training + protein over weeks to months. Real muscle gain is 0.5-2 kg per month for beginners, slower for experienced lifters. Daily muscle gain of 0.1+ kg is impossible.
Key insight: Daily BIA fluctuations are primarily water redistribution and measurement variability, not actual body composition changes.
How to Get Consistent BIA Measurements
Consistency minimizes measurement variation and makes trends meaningful even if absolute accuracy is limited.
Standardized Measurement Protocol
Time of day: Always measure at the same time. Morning upon waking is most consistent (after bathroom, before eating/drinking).
Hydration: Same hydration status each measurement. Don’t measure immediately after drinking large amounts of water.
Food timing: Measure before eating or at least 3 hours after meals.
Exercise timing: Measure at least 12 hours after intense exercise, preferably on rest days.
Menstrual cycle (females): Track cycle phase. Water retention varies significantly (2-3 kg weight fluctuation typical). Compare measurements at same cycle phase month-to-month.
Measurement Technique
Foot placement: Stand barefoot with feet consistently positioned on electrodes. Heels and balls of feet must contact metal plates.
Posture: Stand upright, arms relaxed at sides (not touching torso), legs straight but not locked.
Clothing: Minimal clothing — removes variables. Bare feet mandatory. Consistent clothing weight if measuring with clothes.
Skin condition: Dry, clean feet. No lotion or oil. Remove calluses periodically (increases contact impedance).
Environment: Consistent room temperature (20-24°C optimal). Avoid measuring after hot shower/bath or in very cold room.
Trend Analysis, Not Single Measurements
Weekly averaging: Average 3-4 measurements per week rather than focusing on daily values. This smooths water fluctuation noise.
Monthly comparison: Compare monthly averages, not week-to-week. Real body composition changes accumulate over weeks to months.
Direction over magnitude: Focus on trend direction (decreasing, stable, increasing) rather than absolute numbers. A consistent 2% decrease over 2 months indicates real fat loss even if absolute body fat percentage is inaccurate.
BIA Limitations and When It Fails
BIA works reasonably well for general population tracking trends but fails in specific situations.
When BIA Is Inaccurate
Extreme body compositions:
- Very lean athletes (< 8% body fat men, < 15% women): BIA overestimates body fat
- Obese individuals (> 35% body fat): BIA underestimates body fat
- Very muscular individuals: Equations developed on average population, not athletes
Age extremes:
- Children/adolescents: Rapidly changing body composition, equations don’t account for growth
- Elderly (65+): Decreased muscle mass and altered hydration changes impedance-composition relationship
Medical conditions:
- Edema (fluid retention): Excess water drastically lowers impedance, inflates muscle mass estimate
- Dehydration (severe): Opposite effect — deflates muscle mass estimate
- Lymphedema: Localized fluid accumulation skews regional measurements
- Pacemakers/ICD: Some devices interfere with BIA current (check manufacturer warnings)
Pregnancy: Amniotic fluid, increased blood volume, and changing body composition make BIA unreliable
Prosthetics/amputations: Current path interrupted, equations assume intact limbs
What BIA Cannot Do
Segment-specific accuracy: Claims of “left arm muscle mass” or “right leg fat percentage” from consumer devices are essentially fiction. The impedance measurements aren’t spatially precise enough for reliable segmental analysis.
Visceral fat measurement: Consumer BIA doesn’t measure visceral fat directly — it’s estimated from total body fat and demographic factors. Waist circumference is more reliable for visceral fat assessment.
Day-to-day fat loss tracking: Real fat loss occurs over weeks, not days. Daily BIA variation is primarily water, not fat.
Frequently Asked Questions
Why does my body fat percentage increase after drinking water?
This seems counterintuitive but happens with some BIA algorithms. Water temporarily pools in the digestive system before distributing to tissues. During this 15-30 minute period, you’ve gained weight (from water) but impedance hasn’t dropped proportionally yet, causing BIA to calculate higher body fat percentage. Once water absorbs and distributes, impedance drops and body fat percentage decreases below pre-drinking level.
Can BIA scales tell the difference between muscle and water?
Not directly. BIA measures total impedance, which reflects total lean mass (muscle + water + bone + organs). Scales “separate” muscle from water using statistical models, not direct measurement. These estimates are less accurate than the total fat-free mass calculation.
Are 8-electrode scales more accurate than 4-electrode foot-only scales?
Marginally, for whole-body composition. 8-electrode (hand-to-hand, hand-to-foot, foot-to-foot combined) measure arms and legs separately, reducing impact of regional fat distribution. Studies show 3-5% better accuracy vs reference methods. However, they’re more expensive and still have the same fundamental limitations of BIA technology.
Why does my scale show different body fat than my gym’s scale?
Different regression equations and measurement conditions. Each manufacturer uses proprietary equations developed on different populations. Foot contact quality, hydration status, and time of day also differ between measurements. Two BIA devices can give 3-5% different readings on the same person at the same time.
Should I trust my scale’s metabolic rate estimate?
No. Metabolic rate estimates are calculated from estimated muscle mass using standard equations (Mifflin-St Jeor or Harris-Benedict). Error compounds through multiple estimation steps. Measured resting metabolic rate (via metabolic cart) is 10-20% more accurate than BIA scale estimates. Use scale estimates as rough approximations only.
Is BIA safe for everyone?
BIA is safe for most people — the current is extremely low (500-800 microamps) and imperceptible. However, manufacturers warn against use with pacemakers or implanted cardioverter-defibrillators (ICDs). The BIA current theoretically could interfere with device function, though no documented incidents exist. Pregnant women should consult doctors, though BIA is considered safe — the concern is accuracy, not safety.
Key Takeaways
Bioelectrical Impedance Analysis measures electrical impedance through your body — the only directly measured value. Everything else (body fat percentage, muscle mass, bone density, visceral fat) is estimated through mathematical regression equations that compare your impedance to reference populations measured with gold-standard methods like DEXA. Accuracy depends entirely on how well you match the population used to develop these equations.
BIA accuracy for body fat percentage is ±3-5% compared to DEXA in general population individuals under controlled measurement conditions. This error increases significantly for athletes, very lean individuals, obese individuals, elderly, and anyone measuring under inconsistent conditions (varying hydration, food intake, exercise timing, time of day). Daily body fat fluctuations of 2-3% are normal and reflect water redistribution, not actual fat changes.
The value of consumer BIA scales lies in trend tracking, not absolute accuracy. Measuring under standardized conditions (same time of day, hydration status, food timing) and analyzing weekly averages over months reveals meaningful body composition trends despite limited absolute accuracy. A consistent 2% body fat decrease over two months indicates real fat loss even if your actual body fat percentage is 3-5% different from the displayed value.
BIA fails completely for segmental body composition analysis (individual limb or regional measurements), visceral fat quantification, and day-to-day tracking of small changes. Real body composition changes accumulate over weeks to months through sustained calorie deficit/surplus and training. Daily variations are measurement noise and water fluctuation, not meaningful composition changes. Use BIA scales as trend monitoring tools with realistic expectations, not precision measurement instruments.
Related guides:
- The Truth About Smart Scale Accuracy: What Scales Actually Measure
- 7 Smart Health Gadgets to Track Sleep and Heart Rate
- Heart Rate Variability Monitors: Stress Tracking Beyond Basic Fitness
- ⭐ The 5 Best Smartwatches for Android Users Under $100 (2026)
- Massage Guns: Professional vs. Budget Models – Which to Buy?