Fitness trackers display heart rate zones — Zone 2, fat burn, cardio, peak — yet most users don’t understand what these zones represent physiologically, why training in specific zones produces different adaptations, or whether the zone calculations their device uses are even accurate for their individual physiology.
This guide explains the science behind heart rate training zones, how they’re calculated from maximum heart rate, what metabolic and cardiovascular adaptations occur in each zone, and why personalized zone testing matters more than generic formulas built into consumer fitness devices.
Quick Navigation
- What Heart Rate Zones Are
- Maximum Heart Rate Calculation
- The Five Heart Rate Zones
- Zone 1: Recovery and Warm-Up
- Zone 2: Aerobic Base Building
- Zone 3: Tempo Training
- Zone 4: Lactate Threshold
- Zone 5: Maximum Effort
- Metabolic Differences Between Zones
- Training Adaptations by Zone
- Common Heart Rate Zone Mistakes
- FAQ
What Heart Rate Zones Are
Heart rate zones are ranges of heartbeats per minute (BPM) that correspond to different exercise intensities and produce distinct physiological adaptations. Training at specific heart rates triggers specific metabolic pathways and cardiovascular responses.
The Physiological Basis
Heart rate correlates with oxygen consumption (VO₂)
As exercise intensity increases, your body requires more oxygen to produce energy. Heart rate increases proportionally to deliver more oxygenated blood to working muscles. This predictable relationship allows heart rate to serve as a proxy for exercise intensity.
Different intensities use different fuel sources
Low-intensity exercise (low heart rate) primarily burns fat for fuel. High-intensity exercise (high heart rate) primarily burns carbohydrates (glycogen). Medium intensities use a mix. Heart rate zones roughly correspond to these metabolic transitions.
Different intensities create different adaptations
Low-intensity training improves fat metabolism and mitochondrial density. High-intensity training improves anaerobic capacity and lactate tolerance. Medium intensities improve aerobic efficiency. Targeting specific zones enables targeted training outcomes.
Zone Systems: 3-Zone vs 5-Zone
3-Zone system: Easy / Moderate / Hard (used in some simplified training plans)
5-Zone system: Recovery / Aerobic / Tempo / Threshold / Maximum (most common, explained in detail below)
7-Zone system: Adds finer distinctions within zones (used in advanced training but adds complexity without significant benefit for most athletes)
This guide focuses on the 5-zone system — detailed enough to be useful, simple enough to be practical.
Maximum Heart Rate Calculation
Heart rate zones are calculated as percentages of maximum heart rate (MHR) — the highest heart rate you can achieve during all-out effort.
Generic Age-Based Formula
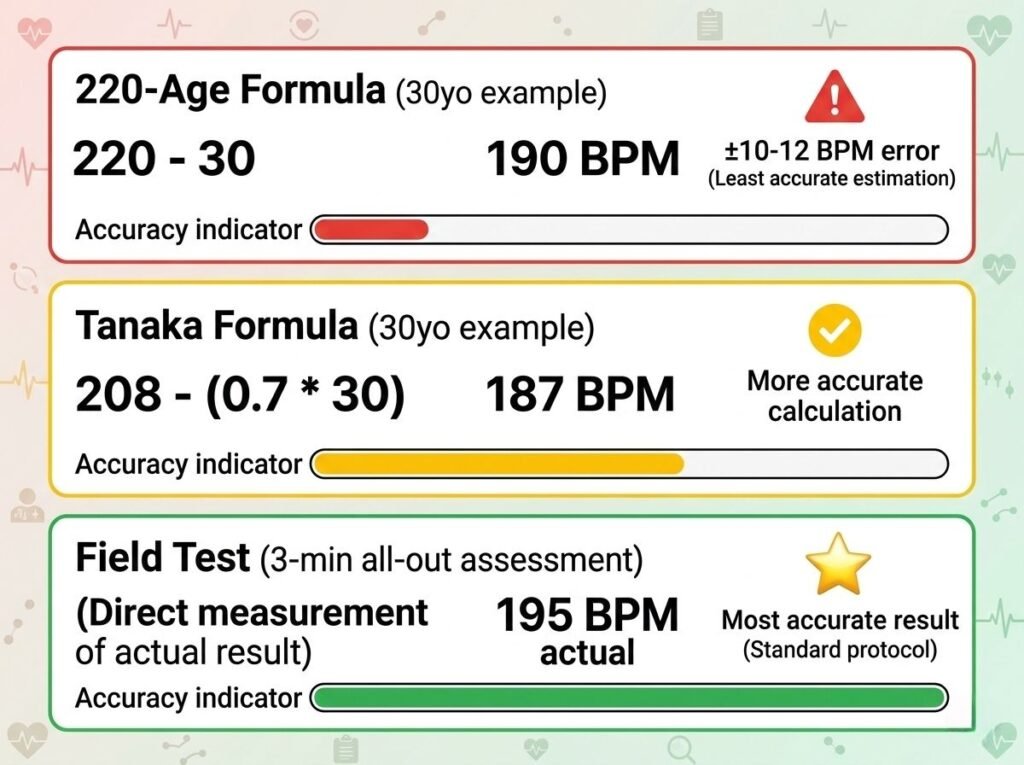
220 – Age = Estimated Maximum Heart Rate
Example: 30-year-old
MHR = 220 – 30 = 190 BPM
This formula is built into virtually all fitness trackers and is used by default when no personalized data is available.
Problems With Generic Formula
Individual variation is massive: The 220-age formula has a standard deviation of ±10-12 BPM. This means for a 30-year-old with estimated MHR of 190, actual MHR could be anywhere from 178-202 BPM and still be “normal.”
Doesn’t account for fitness level: Trained athletes often have higher maximum heart rates than predicted. Sedentary individuals may have lower.
Doesn’t account for genetics: Some people genetically have higher or lower maximum heart rates regardless of fitness or age.
Results in incorrect zone calculations: If your actual MHR is 202 but the formula estimates 190, all your zones will be calculated too low. You’ll think you’re in Zone 4 when you’re actually in Zone 3.
According to research published by the American College of Sports Medicine, the 220-age formula produces accurate zones for only about 60% of individuals — the rest have zones that are off by 5-15 BPM.
More Accurate Formulas
Tanaka Formula (slightly better): 208 – (0.7 × Age)
Example: 30-year-old
MHR = 208 – (0.7 × 30) = 208 – 21 = 187 BPM
This formula accounts for the fact that maximum heart rate doesn’t decline linearly with age — it decreases more slowly than the 220-age formula suggests.
Inbar Formula (for trained athletes): 205.8 – (0.685 × Age)
Still a formula, still has individual variation, but slightly more accurate for fit populations.
Field Testing Maximum Heart Rate
Most accurate method: All-out effort test
Protocol:
- Warm up thoroughly (10-15 minutes)
- Perform 3-minute all-out effort (running uphill, cycling, rowing)
- Record highest heart rate achieved
- Repeat 1-2 more times to confirm
Safety note: Maximum heart rate testing requires high fitness level and should be done under medical supervision if you have any cardiovascular concerns or are over 40 without recent medical clearance.
The Five Heart Rate Zones Explained
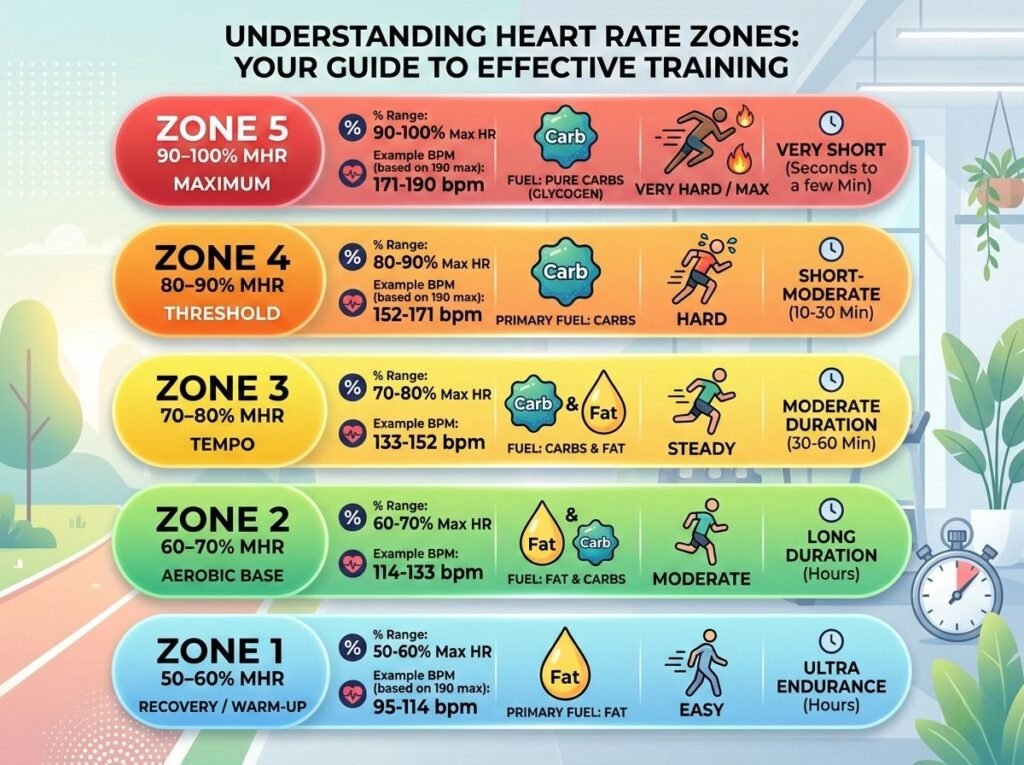
Zones are calculated as percentages of maximum heart rate. Using the example MHR of 190 BPM:
Zone 1: 50-60% MHR = 95-114 BPM
Zone 2: 60-70% MHR = 114-133 BPM
Zone 3: 70-80% MHR = 133-152 BPM
Zone 4: 80-90% MHR = 152-171 BPM
Zone 5: 90-100% MHR = 171-190 BPM
These percentages represent intensity, not “effectiveness.” All zones serve specific training purposes.
Zone 1: Recovery and Warm-Up (50-60% Max HR)
Feel: Very easy, can hold full conversation without breathing interruption
Breathing: Relaxed, through nose comfortably
Primary fuel: Almost entirely fat (>85% of calories from fat oxidation)
Lactate: Minimal production, easily cleared
Duration: Unlimited — can sustain for hours
Physiological Effects
Increased blood flow: Gentle movement promotes circulation without creating metabolic stress. Useful for active recovery between hard training sessions.
Capillary development: Very light activity still stimulates capillary formation in muscles, improving oxygen delivery infrastructure.
Fat oxidation practice: Body practices using fat for fuel efficiently. While you burn few total calories in Zone 1, the percentage from fat is highest.
When to Use Zone 1
Active recovery days: Day after hard workout to promote blood flow without adding training stress
Warm-up: First 5-10 minutes of any workout to gradually increase heart rate and muscle temperature
Cool-down: Final 5-10 minutes to gradually lower heart rate and begin recovery process
Injury rehabilitation: Very low intensity allows movement without stress during injury recovery
Not recommended for: Improving fitness. Zone 1 is too easy to create meaningful cardiovascular or metabolic adaptations. It’s useful for recovery and warm-up, not for training adaptations.
Zone 2: Aerobic Base Building (60-70% Max HR)
Feel: Comfortable, can hold conversation but occasional breathing pauses
Breathing: Nasal breathing possible but may need mouth occasionally
Primary fuel: Roughly 70% fat, 30% carbohydrate
Lactate: Production equals clearance (steady-state)
Duration: 1-6 hours for trained individuals
Physiological Effects
Mitochondrial biogenesis: Zone 2 training is the most effective intensity for increasing mitochondrial density in muscle cells. More mitochondria = more aerobic energy production capacity.
Improved fat oxidation: Body becomes more efficient at burning fat for fuel, sparing glycogen for higher intensities.
Capillary development: Maximum capillary growth occurs in Zone 2. More capillaries = better oxygen delivery to muscles.
Cardiac efficiency: Heart becomes more efficient at pumping blood. Stroke volume (blood per heartbeat) increases, allowing lower heart rate at submaximal intensities.
Aerobic enzyme production: Increased production of enzymes involved in aerobic energy production.
When to Use Zone 2
Aerobic base building: 70-80% of total training volume for endurance athletes should be Zone 2
Long slow distance (LSD) workouts: 1-3 hour runs/rides at conversational pace
Fat adaptation: Teaching body to preferentially use fat, important for ultra-endurance events
Cardiovascular health: Zone 2 provides maximum cardiovascular benefits with minimal injury risk
Most important zone: For general fitness and longevity, Zone 2 is the most valuable training zone. It’s where most cardiovascular and metabolic adaptations occur with minimal stress and injury risk.
For comprehensive fitness tracking beyond heart rate, see our guide to smart health gadgets for tracking sleep and heart rate.
Zone 3: Tempo Training (70-80% Max HR)
Feel: Moderately hard, conversation difficult but possible in short sentences
Breathing: Primarily through mouth, rhythmic breathing required
Primary fuel: Roughly 50% fat, 50% carbohydrate
Lactate: Slight accumulation but manageable for extended periods
Duration: 30 minutes to 2 hours depending on fitness
Physiological Effects
Lactate clearance improvement: Body becomes better at clearing lactate produced during exercise, raising the intensity at which lactate accumulation becomes limiting.
Glycolytic enzyme development: Enzymes involved in carbohydrate metabolism increase, improving ability to generate energy from glycogen.
Mental toughness: Zone 3 is uncomfortable without being extremely painful — good for developing mental resilience.
Race pace for many events: Zone 3 corresponds to sustainable pace for events lasting 1-3 hours (half marathons, Olympic distance triathlons).
When to Use Zone 3
Tempo runs/rides: Sustained efforts at “comfortably hard” pace (20-60 minutes)
Race pace training: Practicing the intensity you’ll hold during goal race
Transition workouts: Bridging gap between easy aerobic work and hard threshold efforts
Limited use recommended: Zone 3 is sometimes called the “gray zone” — too hard to build aerobic base efficiently, not hard enough to maximize high-intensity adaptations. Easy to accumulate fatigue here without proportional benefits.
Problem with Zone 3: Many recreational athletes spend too much time here — going too hard on easy days (should be Zone 2) and not hard enough on hard days (should be Zone 4-5). This creates chronic fatigue without optimal adaptations.
Zone 4: Lactate Threshold (80-90% Max HR)
Feel: Hard, can only speak a few words at a time
Breathing: Heavy, deep breaths through mouth required
Primary fuel: Roughly 70-80% carbohydrate, 20-30% fat
Lactate: Accumulating rapidly, approaching maximum clearance rate
Duration: 15-60 minutes depending on fitness
Physiological Effects
Lactate threshold improvement: The intensity at which lactate production exceeds clearance increases. This is one of the most important predictors of endurance performance.
VO₂ max improvement: Maximal oxygen consumption increases, improving aerobic capacity.
Anaerobic capacity development: Body becomes better at producing energy without oxygen (important for high-intensity efforts).
Muscle fiber recruitment: Fast-twitch muscle fibers begin recruiting, teaching body to use full muscle fiber spectrum.
When to Use Zone 4
Threshold intervals: 3-5 repetitions of 8-20 minutes at threshold with short recovery
FTP (Functional Threshold Power) work: Cycling-specific sustained threshold efforts
Race pace for shorter events: 10K runs, time trials, criterium races
High-intensity continuous training (HICT): Sustained efforts just below anaerobic threshold
Key intensity for performance: Zone 4 training provides the biggest performance gains for competitive athletes. It’s where you raise the ceiling on sustainable pace.
Limited frequency: 1-2 Zone 4 sessions per week maximum. More creates excessive fatigue and injury risk. Requires 48-72 hours recovery between sessions.
Zone 5: Maximum Effort (90-100% Max HR)
Feel: Extremely hard, cannot speak
Breathing: Gasping, maximal respiratory rate
Primary fuel: Almost entirely carbohydrate (glycogen and blood glucose)
Lactate: Accumulating faster than clearance, rising rapidly
Duration: 30 seconds to 8 minutes depending on specific intensity within zone
Physiological Effects
VO₂ max maximization: Training at or near VO₂ max produces largest improvements in maximal aerobic capacity
Anaerobic power: Improves ability to generate maximum power output for short durations
Neuromuscular coordination: High-intensity work improves nervous system’s ability to recruit maximum muscle fibers
Pain tolerance: Mental adaptation to operating at maximum discomfort level
When to Use Zone 5
VO₂ max intervals: 3-8 minutes at maximum sustainable effort with equal or longer recovery
Sprint intervals: 30 seconds to 2 minutes all-out with long recovery (3-5× work duration)
Race pace for short events: 5K runs, track cycling, short time trials
Finishing kick practice: Teaching body to accelerate when already fatigued
Minimal volume needed: 5-10% of total training volume is Zone 5. Small doses provide benefits, large doses create injury and overtraining risk.
Recovery requirement: Zone 5 sessions require 48-72 hours recovery. No more than 1-2 sessions per week.
Metabolic Differences Between Zones
Fuel Utilization by Zone
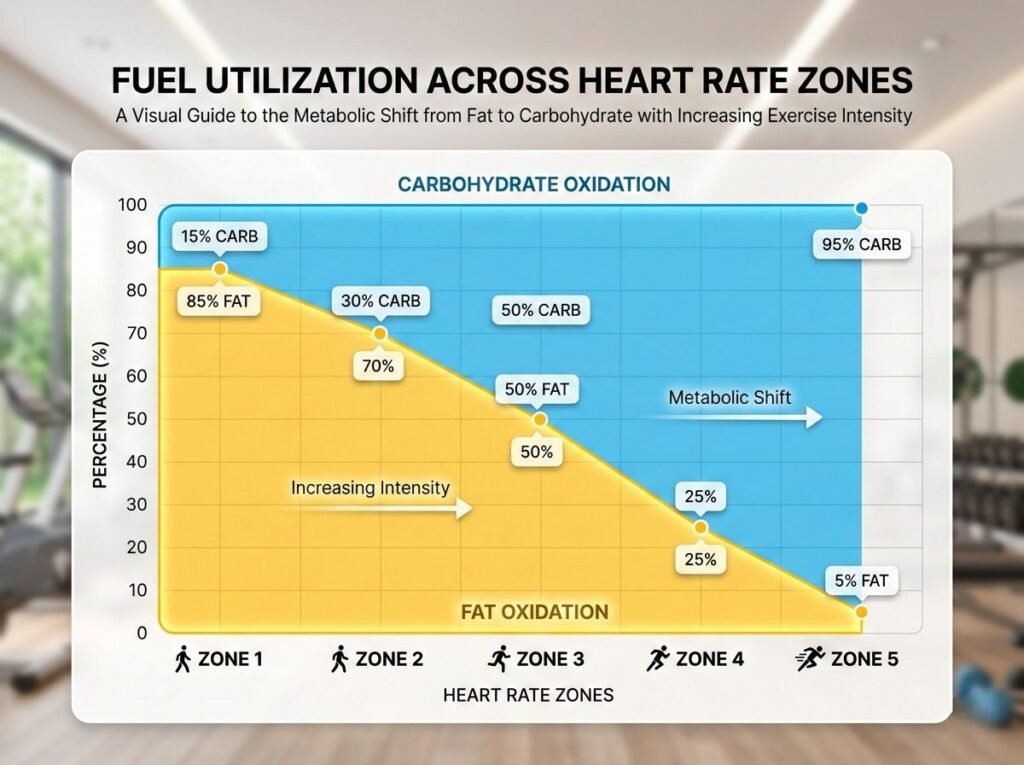
Zone 1: 85% fat, 15% carbohydrate
Zone 2: 70% fat, 30% carbohydrate
Zone 3: 50% fat, 50% carbohydrate
Zone 4: 25% fat, 75% carbohydrate
Zone 5: 5% fat, 95% carbohydrate
These percentages show relative contribution of each fuel source. Total calorie burn increases with intensity, so Zone 5 burns more total fat calories than Zone 1 despite lower percentage — but cannot be sustained as long.
Energy Systems by Zone
Zones 1-2: Primarily aerobic metabolism (oxygen-dependent fat and carbohydrate oxidation)
Zone 3: Mixed aerobic and beginning anaerobic contribution
Zone 4: Aerobic system maximally stressed, significant anaerobic contribution
Zone 5: Maximum aerobic contribution plus heavy anaerobic glycolysis
Understanding these systems explains why you can exercise for hours in Zone 2 but only minutes in Zone 5 — you’re using fundamentally different energy production pathways.
Training Adaptations by Zone
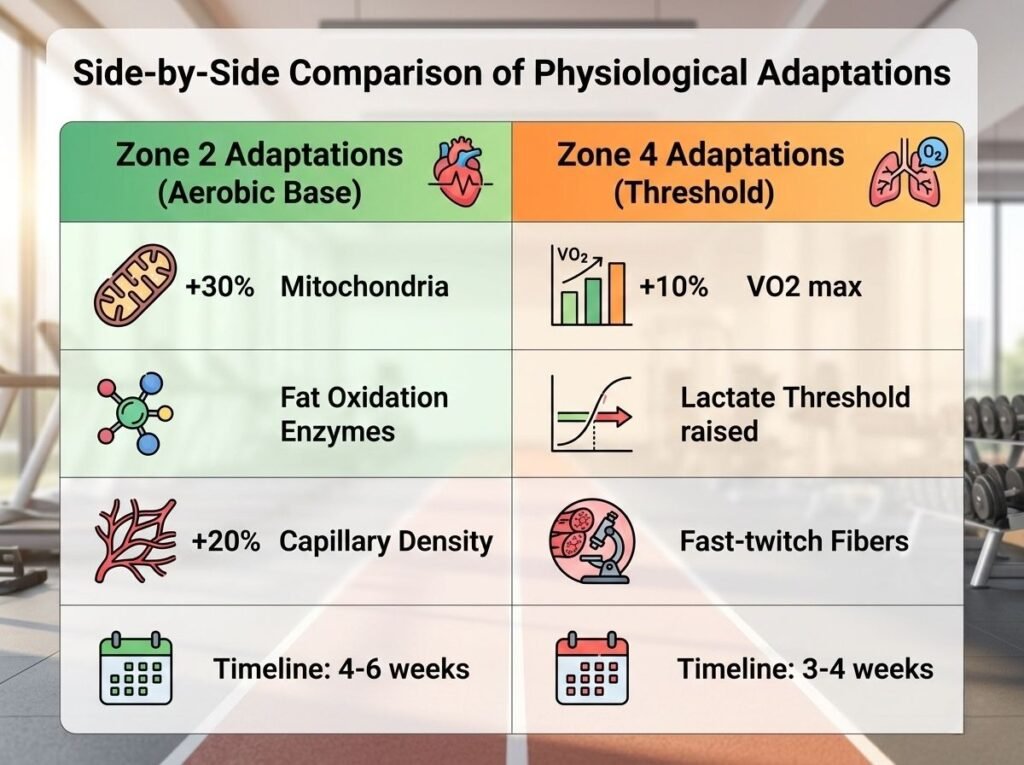
Zone 2 Adaptations (Aerobic Base)
Cardiovascular: Increased stroke volume, cardiac output, lower resting heart rate
Metabolic: Mitochondrial density +20-40%, improved fat oxidation enzymes
Muscular: Capillary density +15-25%, slow-twitch fiber efficiency
Timeline: Noticeable improvements in 4-6 weeks, continued gains for 12-16 weeks
Zone 4 Adaptations (Threshold)
Cardiovascular: Increased VO₂ max (+5-15% over 12 weeks)
Metabolic: Lactate threshold raised (+10-20 BPM), buffering capacity improved
Muscular: Fast-twitch fiber recruitment, glycolytic enzyme production
Timeline: Noticeable improvements in 3-4 weeks, plateau after 8-12 weeks without progression
Zone 5 Adaptations (Maximum)
Cardiovascular: Maximum cardiac output increased
Metabolic: Anaerobic capacity +10-20%, glycolytic power
Neuromuscular: Maximum muscle fiber recruitment, power output
Timeline: Rapid gains in 2-3 weeks, diminishing returns beyond 6-8 weeks
Generic Formulas vs Personalized Zone Testing
Limitations of Generic Zones
220-age formula error: ±10-12 BPM standard deviation means zones could be off by 10-20 BPM
Fitness level not considered: Two people same age can have dramatically different actual maximum heart rates
No individual lactate threshold assessment: Lactate threshold (Zone 4 boundary) varies significantly between individuals
Example of error:
- Actual MHR: 202 BPM
- Formula estimate: 190 BPM
- Zone 4 calculated: 152-171 BPM
- Zone 4 actual: 162-182 BPM
- Training in calculated Zone 4 actually puts you in Zone 3 — missing intended training stimulus
Personalized Zone Testing
Lab testing (gold standard):
- VO₂ max test with lactate sampling
- Precisely identifies aerobic threshold (Zone 2/3 boundary) and lactate threshold (Zone 3/4 boundary)
- Cost: $150-300
Field testing (DIY):
- 30-minute time trial at maximum sustainable effort
- Average heart rate during final 20 minutes = approximate lactate threshold
- Calculate zones from this measured threshold rather than predicted maximum
Drift test (Zone 2 assessment):
- 60-90 minute steady effort
- If heart rate drifts upward >5% while maintaining same power/pace, intensity is above Zone 2
- Adjust downward until heart rate remains stable
For advanced recovery tracking that complements heart rate training, see our guide to Heart Rate Variability Monitors.
Heart Rate Variability and Training Zones
Heart Rate Variability (HRV) — the variation in time between heartbeats — provides insight into autonomic nervous system balance and recovery status. It complements heart rate zone training.
HRV and Training Readiness
High HRV (relative to your baseline): Parasympathetic dominance, good recovery, ready for hard training
Low HRV: Sympathetic dominance, incomplete recovery, prioritize Zone 1-2 or rest
Using HRV to adjust zones:
- Low HRV day: Reduce intensity, extend Zone 2 work
- High HRV day: Opportunity for Zone 4-5 work
- Trending low HRV: Reduce training load overall
HRV prevents overtraining by providing objective recovery data. Heart rate zones tell you what intensity to train; HRV tells you whether you should train hard today.
Common Heart Rate Zone Mistakes
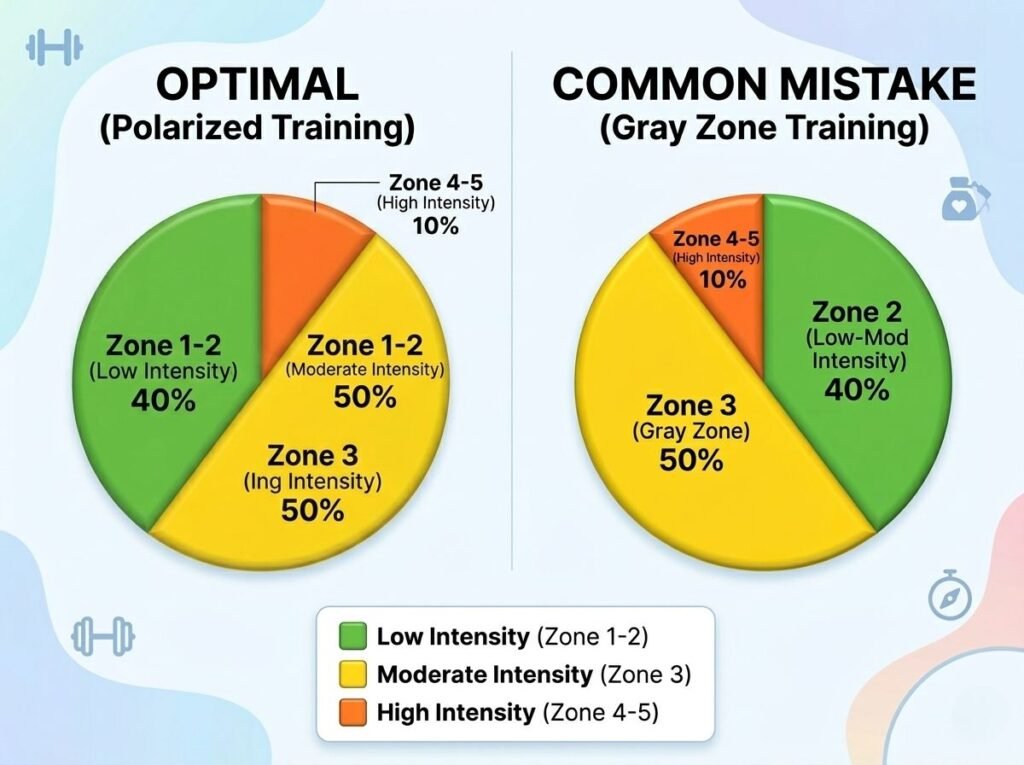
Mistake 1: Training Too Much in Zone 3
Problem: “Gray zone” training — too hard to build aerobic base efficiently, not hard enough for threshold adaptations. Creates fatigue without optimal gains.
Solution: Polarized training — 80% of training in Zone 1-2, 20% in Zone 4-5, minimal Zone 3.
Mistake 2: Using Generic Zones Without Testing
Problem: Zones calculated from 220-age formula are inaccurate for 40% of individuals.
Solution: Field test maximum heart rate or lactate threshold at least once, ideally at start of each training block.
Mistake 3: Ignoring Heart Rate Lag
Problem: Heart rate takes 1-3 minutes to stabilize at target intensity. Looking at instantaneous heart rate during intervals is misleading.
Solution: Pace/power are more accurate for short intervals. Heart rate is better for sustained efforts >10 minutes.
Mistake 4: Training Hard When Fatigued
Problem: Elevated resting heart rate and lower HRV indicate incomplete recovery. Training hard when not recovered creates overtraining risk.
Solution: Monitor resting heart rate and HRV. Adjust training intensity based on recovery status, not just planned workout.
Mistake 5: Never Going Truly Easy
Problem: Zone 2 should feel “too easy” — conversation pace. Many athletes train Zone 3 thinking it’s Zone 2.
Solution: Use talk test. Zone 2 = full sentences comfortably. If you need to pause mid-sentence for breath, slow down.
Frequently Asked Questions
Why does my heart rate stay high in Zone 2 when I slow down?
Cardiac drift — as workout duration extends, heart rate creeps upward even at constant pace/power. Caused by dehydration, rising core temperature, and glycogen depletion. Normal phenomenon, not fitness decline. Stay at target pace/power and let heart rate drift slightly rather than constantly slowing.
Should I train by heart rate or pace?
Depends on goal. Heart rate is better for Zone 2 base building (physiological adaptation matters, exact pace doesn’t). Pace/power is better for Zone 4-5 intervals (heart rate lags prevent accurate short-interval work). Use both: pace for short efforts, heart rate for long efforts.
Can I build fitness training only in Zone 2?
Yes, for general fitness and health. Zone 2 creates most cardiovascular and metabolic adaptations. You won’t optimize race performance without Zone 4-5, but for longevity and health, Zone 2 is sufficient. Many endurance athletes train 80%+ in Zone 2.
Why do fitness trackers show different zones than my calculations?
Most trackers use proprietary zone algorithms rather than standard 5-zone percentages. Some use “fat burn” and “cardio” zones based on different assumptions. Check if your tracker allows custom zone entry and input your tested zones.
My heart rate doesn’t reach calculated Zone 5 — is something wrong?
Your actual maximum heart rate is likely lower than the formula predicts (common in sedentary individuals and with certain medications like beta-blockers). Use field-tested maximum rather than formula. If you can’t reach predicted maximum even during all-out effort, adjust zones based on achieved maximum.
Do zones change as I get fitter?
Maximum heart rate remains fairly constant (decreases slightly with age, not training). But zones become more powerful — you’ll run faster at same Zone 2 heart rate as fitness improves. Lactate threshold moves upward (higher percentage of max HR), so Zone 4 work happens at higher absolute heart rate. Retest zones every 8-12 weeks.
Key Takeaways
Heart rate zones represent distinct physiological intensities that create different training adaptations. Zone 2 (60-70% max HR) builds aerobic base through mitochondrial growth and improved fat oxidation — the foundation of endurance fitness and cardiovascular health. Zone 4 (80-90% max HR) raises lactate threshold, improving sustainable race pace. Zone 5 (90-100%) maximizes VO₂ max and anaerobic capacity. Each zone serves specific purposes; no zone is “better” than others.
Generic age-based formulas (220 – age) produce inaccurate zones for 40% of individuals due to ±10-12 BPM variation in actual maximum heart rate. Field testing maximum heart rate through 3-minute all-out efforts or identifying lactate threshold through 30-minute time trials creates personalized zones that match individual physiology. Using generic zones often results in training too hard on easy days and not hard enough on hard days.
Polarized training — 80% of volume in Zone 1-2, 20% in Zone 4-5, minimal Zone 3 — produces better results than moderate-intensity training (excessive Zone 3). Zone 2 creates aerobic adaptations with minimal fatigue. Zone 4-5 creates performance adaptations but requires recovery. Zone 3 creates fatigue without optimal adaptations from either end of the intensity spectrum.
Heart rate zones work best for efforts lasting 10+ minutes where heart rate stabilizes. For short intervals (< 3 minutes), pace or power provide more accurate intensity control due to heart rate lag. Combining heart rate training with HRV monitoring prevents overtraining by adjusting intensity based on recovery status. Zones tell you what intensity to train; HRV tells you whether to train hard today.
Related guides: